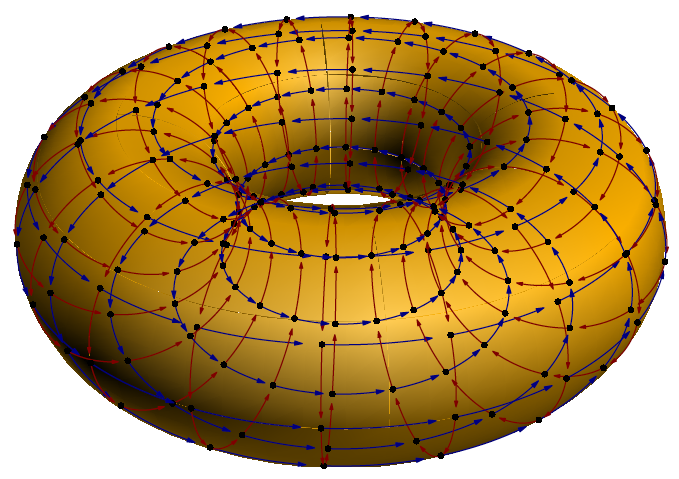
This example plots a lattice of points on the surface of a torus.
\documentclass[border=10pt]{standalone}
\usepackage[inline]{asymptote}
\begin{document}
\begin{asy}[width=\the\linewidth,inline=true]
settings.outformat="pdf";
settings.render=0;
settings.prc=false;
import graph3;

pen surfPen=rgb(1,0.7,0);
pen xarcPen=deepblue+0.7bp;
pen yarcPen=deepred+0.7bp;

currentprojection=perspective(5,4,4);

real R=2;
real a=1;

triple fs(pair t) {
  return ((R+a*Cos(t.y))*Cos(t.x),(R+a*Cos(t.y))*Sin(t.x),a*Sin(t.y));
}

surface s=surface(fs,(0,0),(360,360),8,8,Spline);
draw(s,surfPen,render(compression=Low,merge=true));

int m=20;
int n=10;
real arcFactor=0.85;

pair p,q,v;

for(int i=1;i<=n;++i){
  for(int j=0;j<m;++j){
    p=(j*360/m,(i%n)*360/n);
    q=(((j+arcFactor)%m)*360/m,i*360/n);
    v=(((j+arcFactor/2)%m)*360/m,i*360/n);
    draw(fs(p)..fs(v)..fs(q),xarcPen,Arrow3(size=4));
    q=(j*360/m,((i%n)-arcFactor)*360/n);
    draw(fs(p)..fs((p+q)/2)..fs(q),yarcPen,Arrow3(size=3));
    dot(fs(p));
  }
}
\end{asy}
\end{document}
Source: TeX.SE


