\documentclass[border=10pt]{standalone}
\usepackage[inline]{asymptote}
\begin{document}
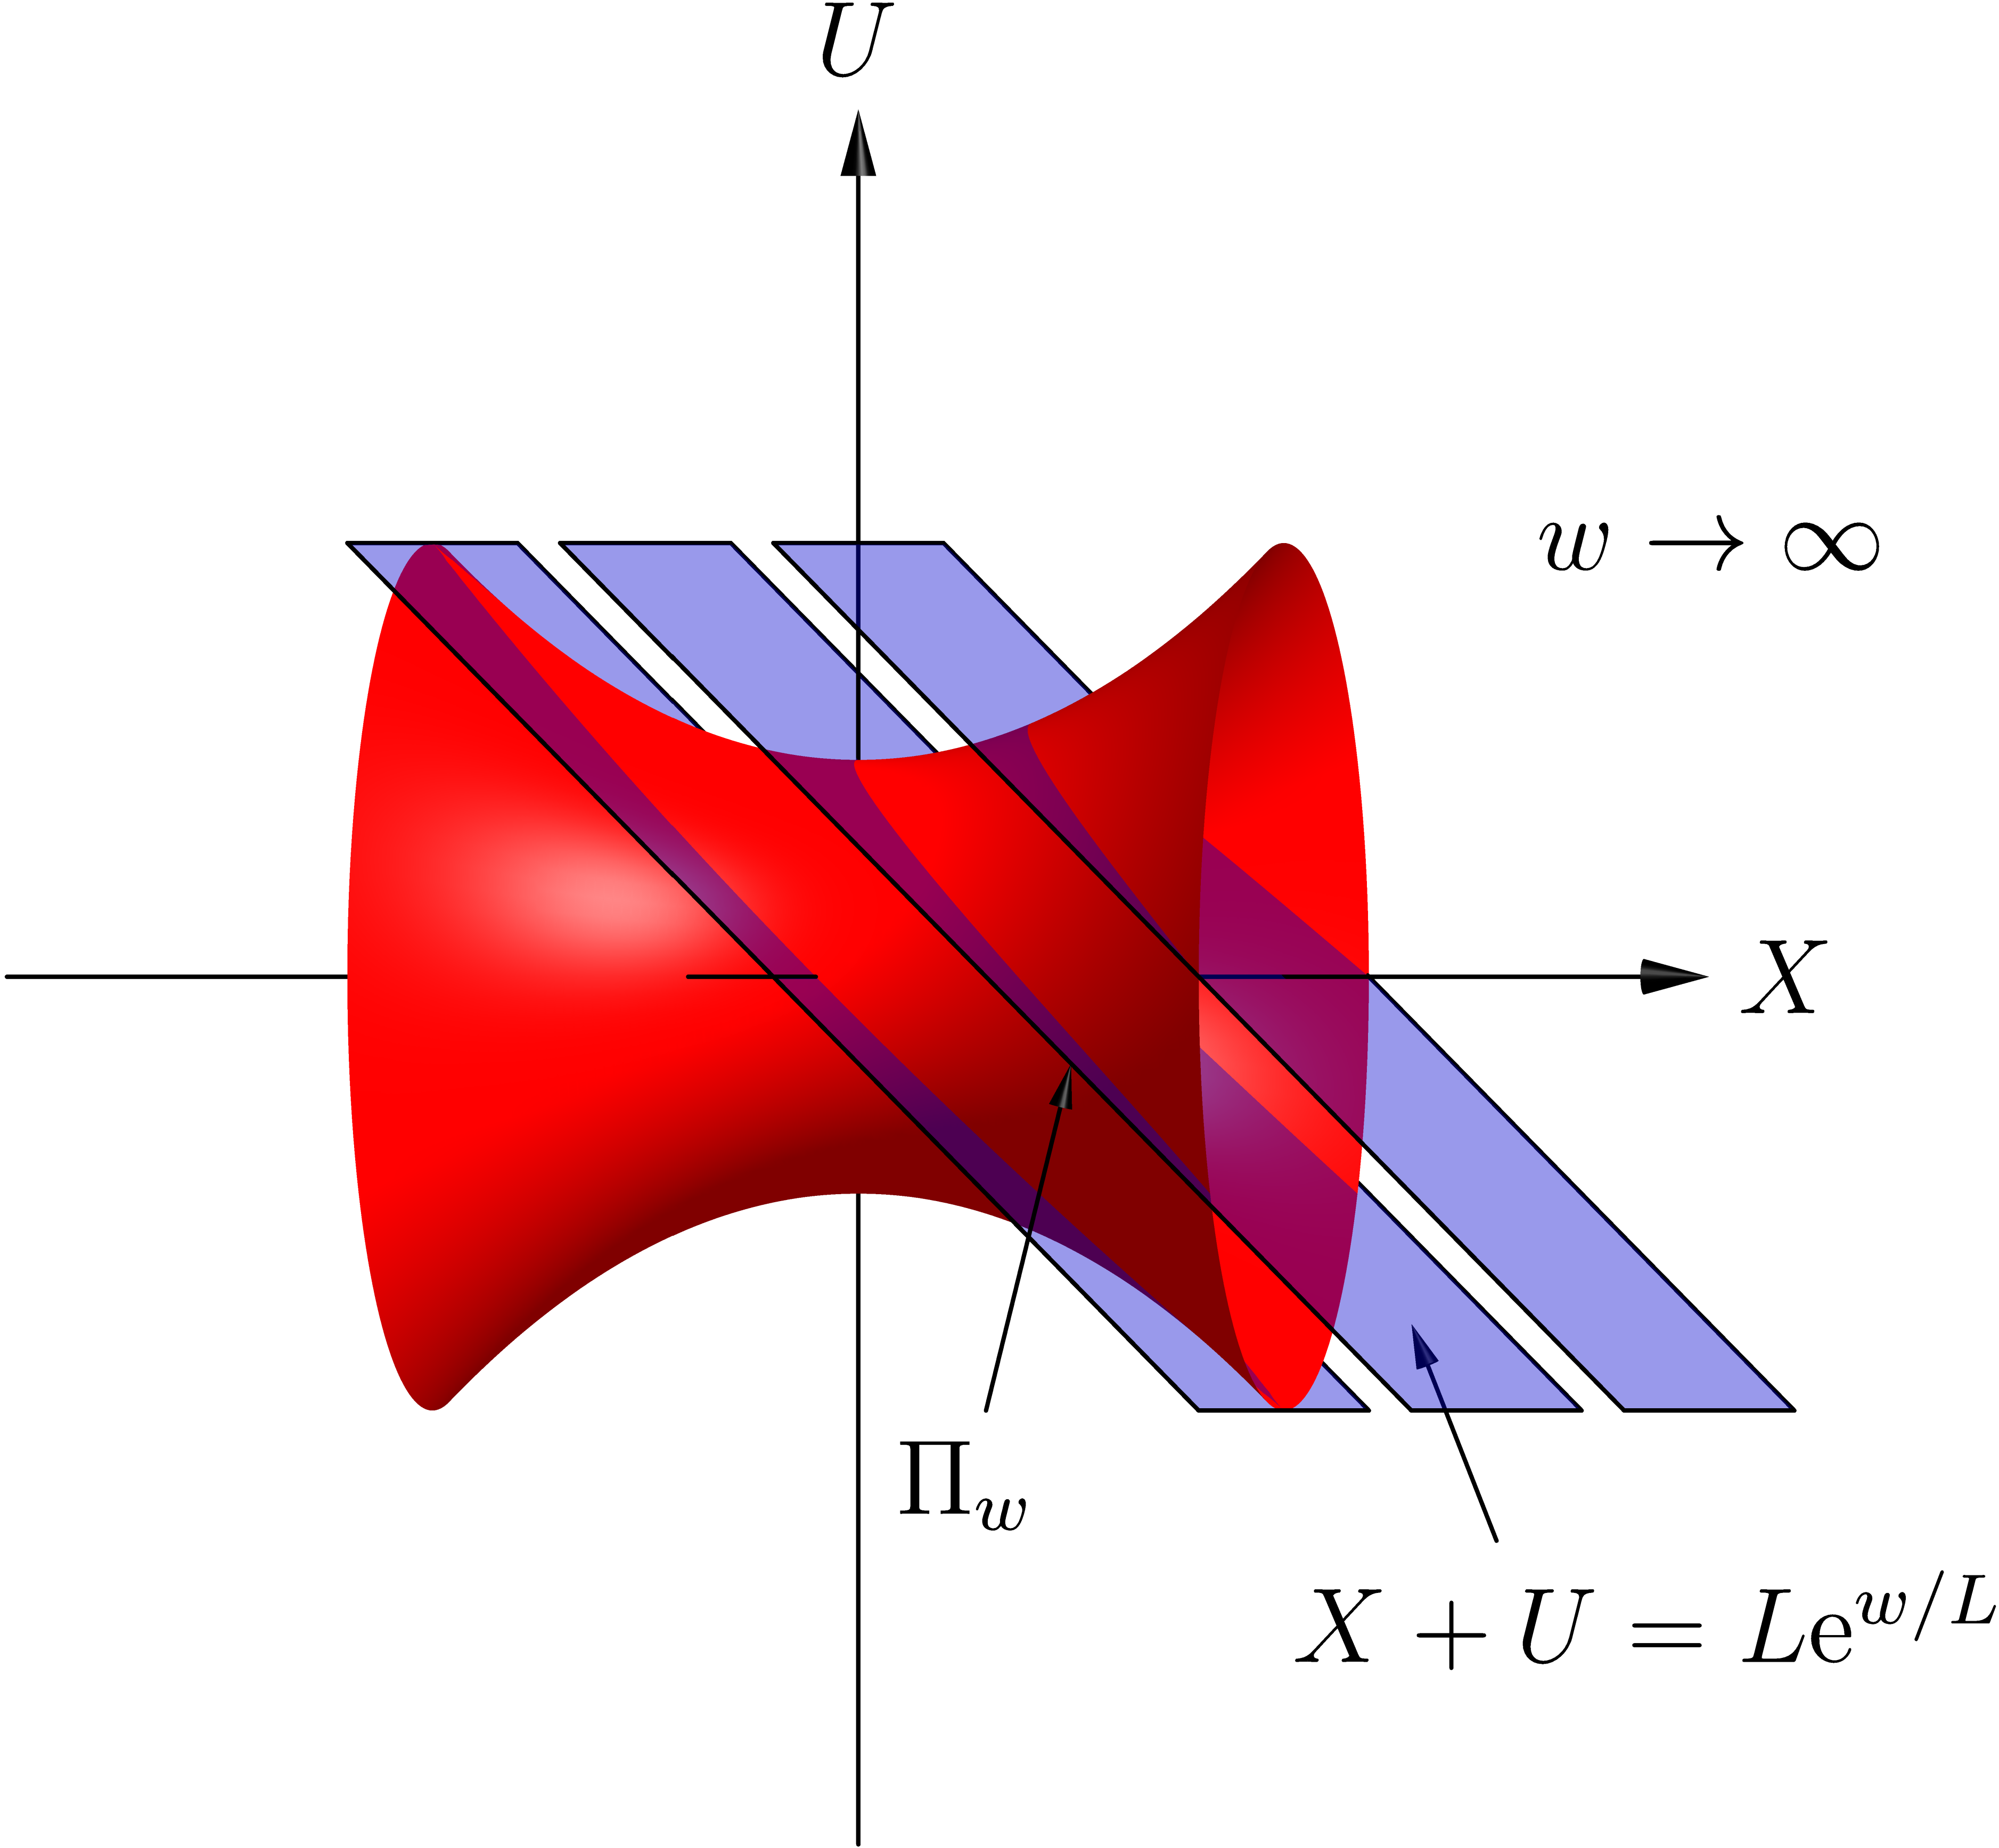
\begin{asy}
// settings.outformat="pdf";
// settings.prc = false;
// settings.render = 16;
settings.render = 0;
import three;
import graph;

size(8cm,0);

currentprojection = orthographic(2,0,10, up=Y);

draw(-2X--2X,arrow=Arrow3(),L=Label("$X$", position=EndPoint));
draw(-2Y--2Y,arrow=Arrow3(),L=Label("$U$", position=EndPoint));
draw(-2Z--2Z);
label("$w \to \infty$",(2,1,0));

draw((0.5,-1,1)--(0.7,-0.2,1),arrow=Arrow3(size=5bp),L=Label("$\Pi_w$", position=BeginPoint));
draw((1.5,-1.3,0)--(1.3,-0.8,0),arrow=Arrow3(size=5bp),L=Label("$X+U = L \mathrm{e}^{w/L}$", position=BeginPoint));

pen color = red;
material surfacepen = material(diffusepen=color+opacity(1.0), emissivepen=0.5*color);
pen color = blue;
material planepen = material(diffusepen=opacity(0.4), emissivepen=0.8*color);

real f(real x) { return .5*x*x+.5; }
path3 p3 = path3(graph(f, -1, 1, operator..));

surface solidsurface = surface(p3, c=O, axis=X);
draw(solidsurface, surfacepen=surfacepen);

path3 p = (-1,1,1) -- (1,-1,1)  -- (1,-1,-1)  -- (-1,1,-1) -- cycle;
for (real s=0.0; s<=1.0; s+=0.5)
{
  draw(shift(s*X)*p);
  draw(surface(shift(s*X)*p), surfacepen=planepen);
}

shipout(scale(4.0)*currentpicture.fit());
\end{asy}
\end{document}
Source: TeX.SE
Author: Henri Menke (License)


