\documentclass[border=10pt]{standalone}
\usepackage[inline]{asymptote}
\begin{document}
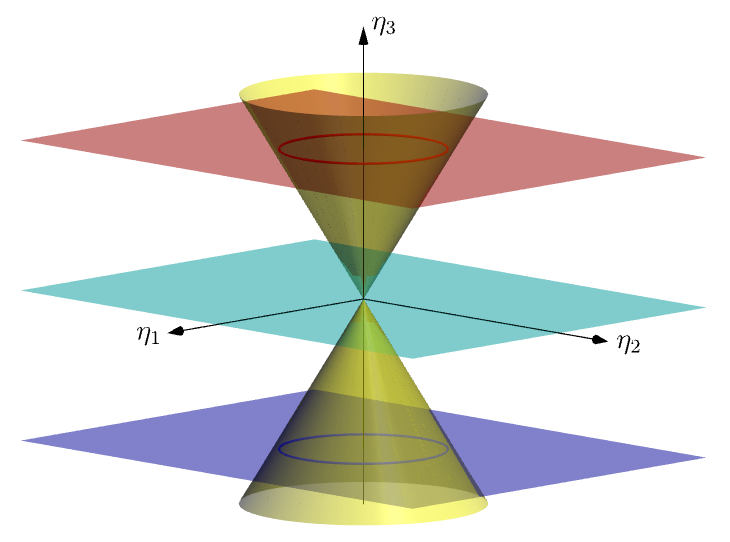
\begin{asy}
settings.render=0;
import graph3;
currentprojection=orthographic(2,2,.5,zoom=.9);
unitsize(1cm);
pen plane1=red, plane2=cyan, plane3=blue,pcone=yellow;
real a=1.8,h=3;
surface c=scale(a,a,h)*shift(0,0,-1)*unitcone;
draw(zscale3(-1)*c,pcone+opacity(.5));
draw(c,pcone+opacity(.3));

real b=2.2;
path3 g=scale3(b/a)*unitcircle3;
draw(shift(0,0,b)*g,plane1+1pt);
draw(shift(0,0,-b)*g,plane3+1pt);

surface pl=shift(-3,-4,0)*scale(6,8,0)*unitplane;
draw(shift(0,0,b)*pl,plane1+opacity(.3));
draw(pl,plane2+opacity(.3));
draw(shift(0,0,-b)*pl,plane3+opacity(.3));

draw(Label("$\eta_1$",EndPoint),O--4*X,Arrow3);
draw(Label("$\eta_2$",EndPoint),O--5*Y,Arrow3);
draw(Label("$\eta_3$",EndPoint,align=E),-3Z--4*Z,Arrow3);
\end{asy}
\end{document}
Source: TeX.SE
Author: Black Mild (License)


