\documentclass{article}
\usepackage[inline]{asymptote}
\usepackage{lmodern}
\begin{document}
\begin{asy}
size(300,200,IgnoreAspect);
import graph;
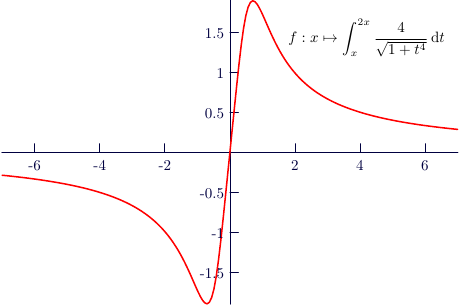
real F(real t){return 4/sqrt(1+t^4);}
real f(real x){return simpson(F,x,2x);}
pen axPen=darkblue;
pen fPen=red+1bp;
draw(graph(f,-7,7,n=200),fPen);
string noZero(real x) {return (x==0)?"":string(x);}
defaultpen(fontsize(10pt));
xaxis(axPen,LeftTicks(noZero,Step=2));
yaxis(axPen,RightTicks(noZero,Step=0.5));

label("$f:x\mapsto \displaystyle\int_x^{2x}"
     +"\frac{4}{\sqrt{1+t^4}}\, \textrm{d}t$"
  ,(1.7,f(1.7)),NE);
\end{asy}
\end{document}
Source: TeX.SE


